Although there has been a fair amount of research into the monsoon, there are still far more questions than answers about how it works, and if the seasonal amount of rain, potential start date, or other characteristics can be predicted. I listened to the Southwest Climate Podcast from CLIMAS, the Climate Assessment for the Southwest, to learn more about what affects the monsoon and its rainfall, and how Monsoon 2021 is shaping up, and reached out to the podcast co-hosts, Zack Guido and Mike Crimmins, for help with this post.
Rainfall, as anyone who has read the ENSO Blog before will know, is an extremely complicated thing to predict! When you add in the sparse rain-gauge observations available in the U.S. Southwest and Mexico, it becomes even more difficult to make confident statements about the effects of the monsoon and how it can be predicted. In the podcast episode “2021—a generational monsoon?” Zack listed some of the factors that influence how much moisture is available to the monsoon, including the position of the high-pressure area, wind patterns, and transient weather features. Another player is land-surface feedbacks—wetter soils provide more moisture to the air through evaporation.
Zack also mentioned our good friend El Niño! Here at the ENSO Blog, we’re always curious about the role of ENSO (El Niño/Southern Oscillation, the entire El Niño/La Niña system). He pointed out that ENSO does influence Pacific tropical storms, which can supply moisture to the monsoon.
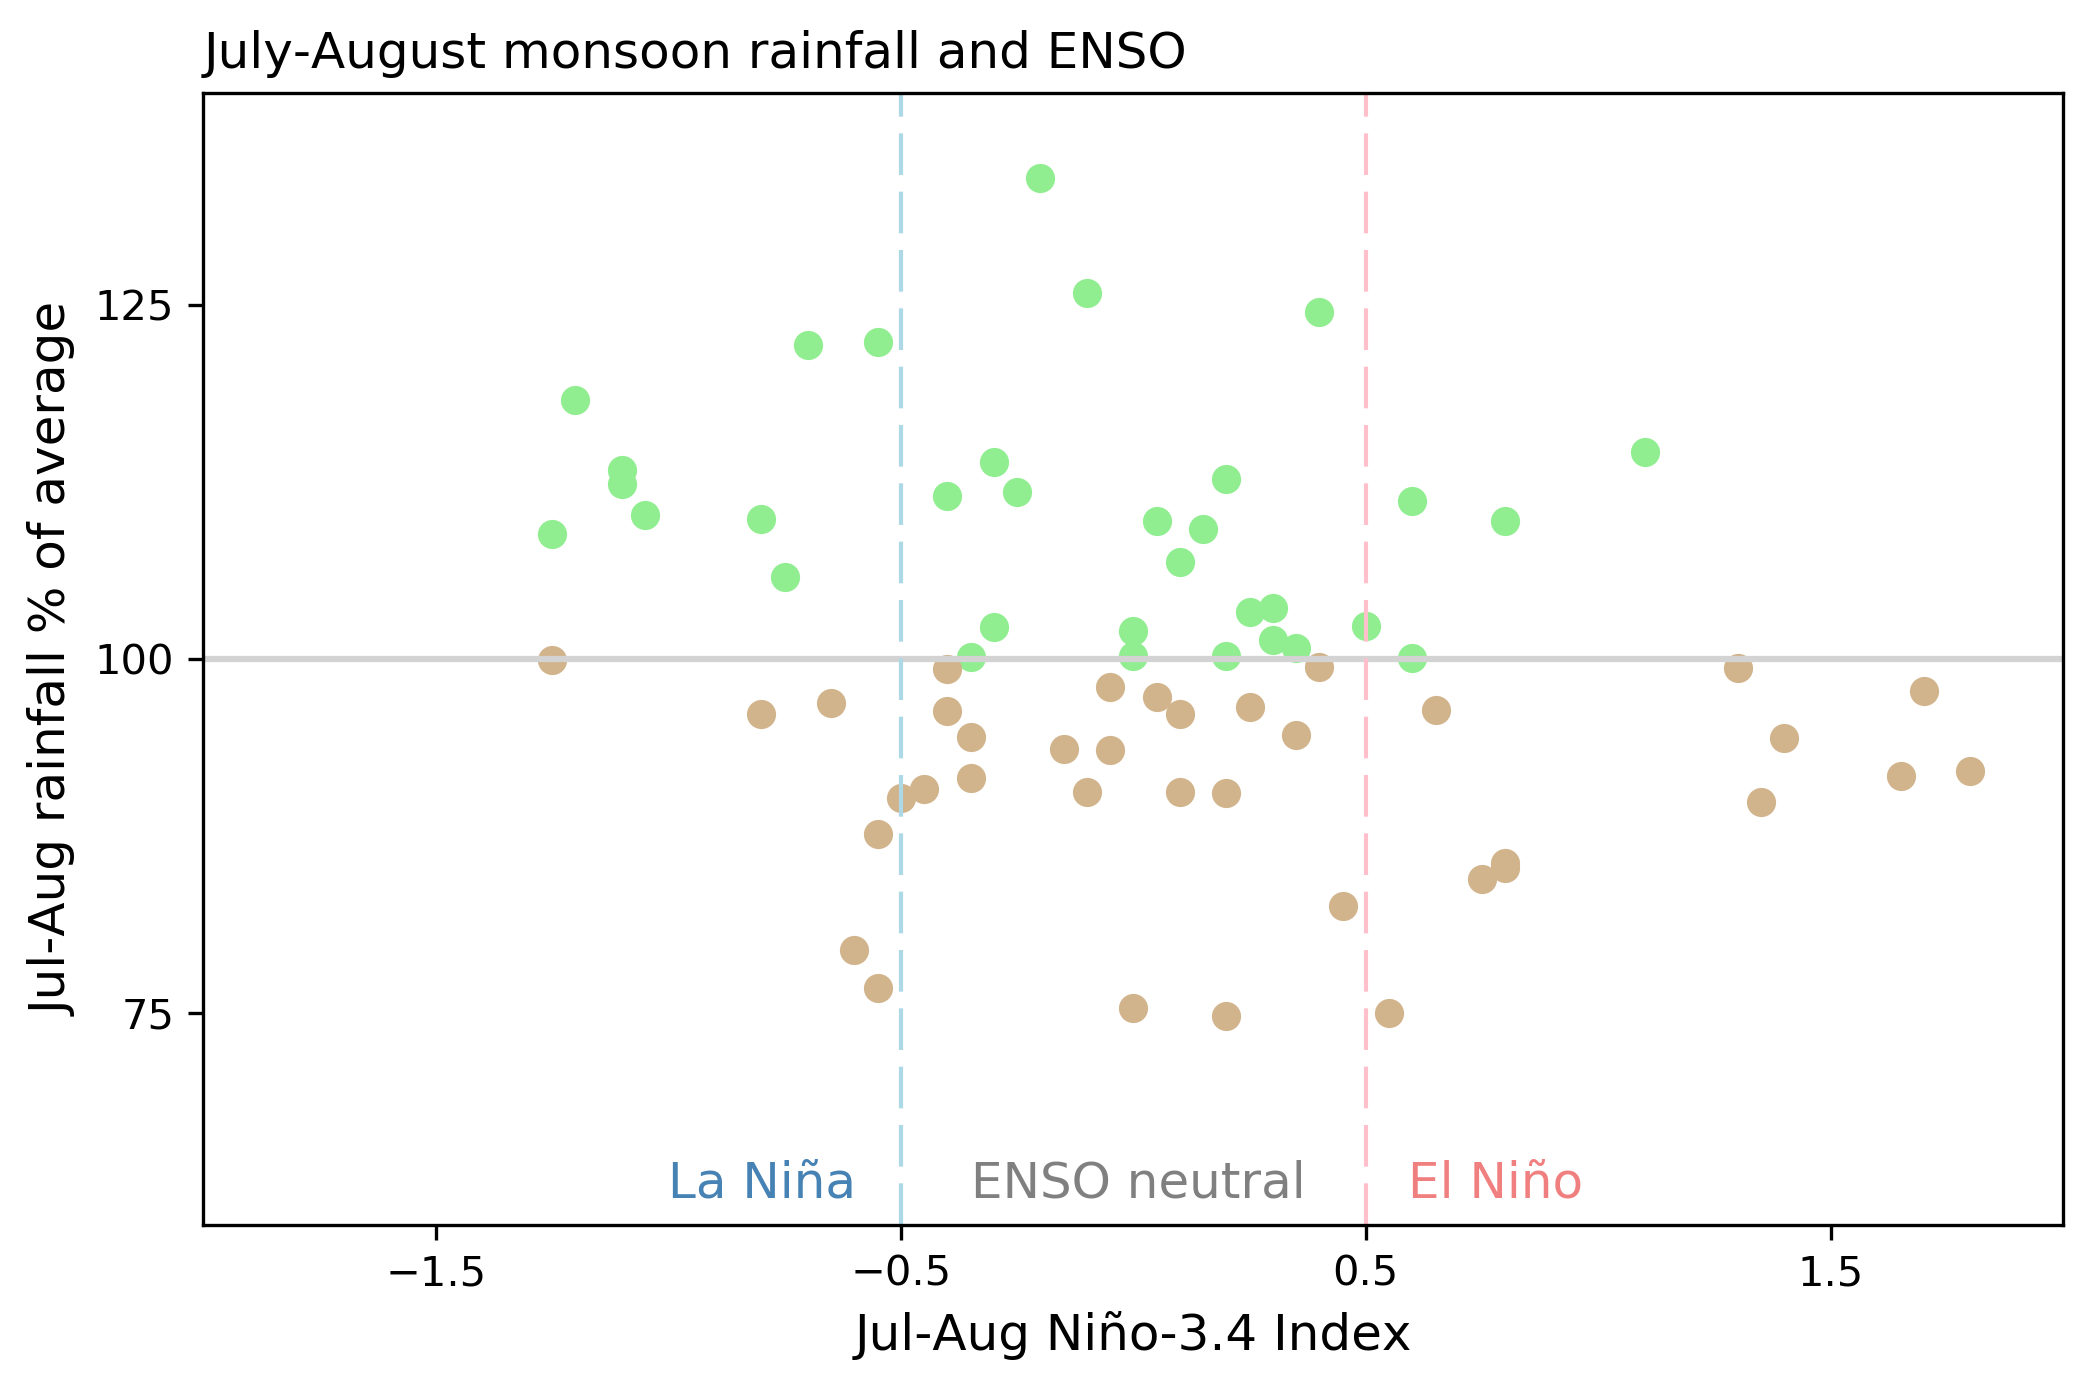
I did a quick comparison of the average July–August rainfall in the monsoon region with the Niño-3.4 index, using 70 years of records. Some earlier studies suggested that El Niño may be related to lower July–August rainfall, and La Niña related to higher rainfall, due to large-scale atmospheric circulation changes. We can see some hints of this relationship in my scatter-plot here.
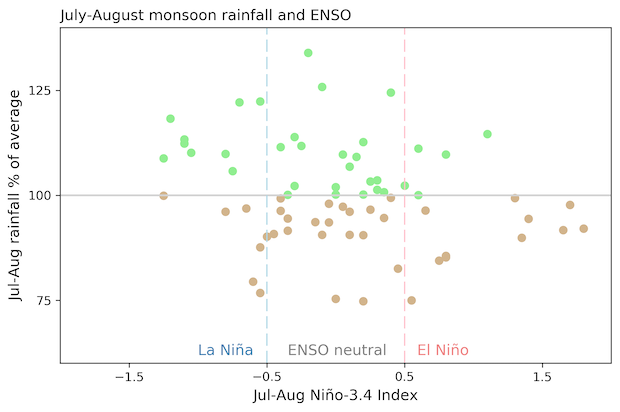
July–August rainfall anomaly averaged over North American Monsoon region for every year 1950–2019 (y-axis) versus Niño-3.4 index (x-axis). Green dots show years with greater-than-average monsoon rainfall while brown dots show less than average. Monsoon region averaged over all land gridpoints, 20°N–37°N, 102°W–115°W. Data from Global Precipitation Climatology Centre (GPCC) and ERSSTv5. Figure by Emily Becker.
“Hey! But El Niño leads to more tropical storms than average,” you’re saying, because you’re not new here. “How would that result in less total July–August rain?” Good question! And yet another element of the monsoon system that needs more study to resolve.


