Seasoned Chaos presents... the North Atlantic Oscillation!

The post was originally published in Seasonal Chaos on September 24, 2020, written by Marybeth Arcodia, Kayla Besong, Kurt Hansen, and Kelsey Malloy

The North Atlantic Oscillation is a Scottish punk rock band that has found commercial success. At least more success than our punk-yodeling band, the Quasi-Biennial Oscillation (OK, that one isn’t real). The Scottish band is named after the North Atlantic Oscillation (NAO), an atmospheric climate pattern – the spotlight of this blog.

Opening Act: Air Pressure

We’ve mentioned air pressure a lot in this blog but we haven’t really defined it. Pressure is just the concentration of air over a certain area and is usually measured in millibars (mb), also known as hectopascals (hPa). Air tends to flow from high pressure to low pressure. However, due to the rotation of the Earth, air is deflected to the right and spirals counterclockwise around the low pressure center in the northern hemisphere. High pressure systems work in the opposite way– air moves clockwise and outward. See if you can find some pressure systems here. Ultimately, air pressure determines the movement and path of storms.

Main Show: The North Atlantic Oscillation

The NAO is primarily an atmospheric oscillation and is identified by pressure. The positive phase of the NAO is associated with very high surface pressure over the Atlantic Ocean between Bermuda and Spain and very low pressure over Greenland. This causes more storms to move over northern Europe and the U.S east coast. During the negative phase of the NAO, there is still high pressure over the Atlantic and low pressure over Greenland but they are much weaker (near average) and the high pressure area is located much closer to Europe. This causes more storms to track over southern Europe and leaves northern Europe and the Eastern U.S. relatively dry. Clearly the NAO is very important for predicting rainfall in the U.S. and Europe, not to mention the other impacts it has on hurricane tracks and tides.

The two modes of the North Atlantic Oscillation and Associated Storminess

The pressure systems, storm tracks, and impacts (wet or dry regions) associated with the NAO negative and positive phases. Adapted from here.

Featuring: Jet Stream

The NAO impacts U.S. and European weather by funking with the jet stream. Each hemisphere has two jets: a subtropical jet and a subpolar jet. We will focus only on the subpolar jet as it is most affected by the NAO and it is more important to U.S. and European weather. The jet stream is a fast-moving “tube” of air flowing around the globe from west to east. The strongest winds are generally in the mid-level of the troposphere flowing around 110mph. The jet stream separates the warm tropical air to the south from the cold polar air to the north. A positive NAO phase generally means a straighter jet stream. The polar air stays north of the jet and the warm air stays to the south of the jet, and everything seems normal (but we know nothing is ever really normal in the atmosphere). So, then a negative NAO phase must mean madness! Not necessarily, but it does mean waviness. Meanders, or waves, in the jet stream cause dry, cool polar air to dip south and warm, moist air from the tropics to reach farther north. These waves of the jet stream can be responsible for the crazy cold or warm temperatures that often seem unseasonable or out of place, such as snow in Alabama or a heat wave in Minnesota.

Encore: Predictability of NAO

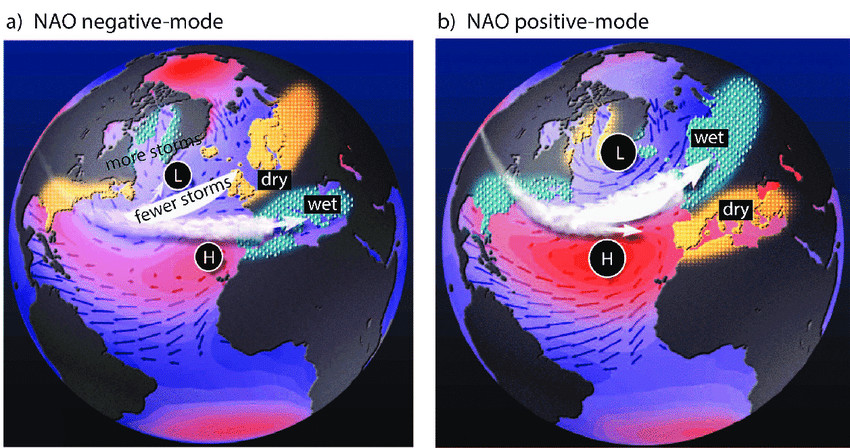
If you live on the east coast of the U.S. or Canada or within Europe, the fate of your winter is often in NAO’s hands. Forecasters really depend on knowing the NAO phase to make long-range outlooks on temperature and precipitation in the cold season (cold season = October through April). If the NAO is neutral, we can’t use it to understand temperature and precipitation patterns.

It can be difficult to predict NAO phases since it both fluctuates a lot within a single season (intraseasonal variability) and fluctuates a lot from year to year (interannual variability). Some phases last months, while others last just days. What this means is that over the past twenty years the NAO may be mostly in a positive phase, however this year the NAO may be mostly negative, but in a single day the NAO could still be positive. Are you confused? Take a look at the figure below. It resembles a harmony of sound waves, but it is actually the same thing: NAO. The song state of the NAO varies based on the perspective you are taking, or the period over where you are averaging, be it monthly, subseasonally, annually, or decadally. If you are listening looking from the decadal lens, the value may be positive while simultaneously being negative if you are looking from the other timescales. Sort of like the difference between the front row versus the nose-bleed section.


(Static image is below, the interactive chart could be accessed here!)

Different Scales for the North Atlantic Oscillation

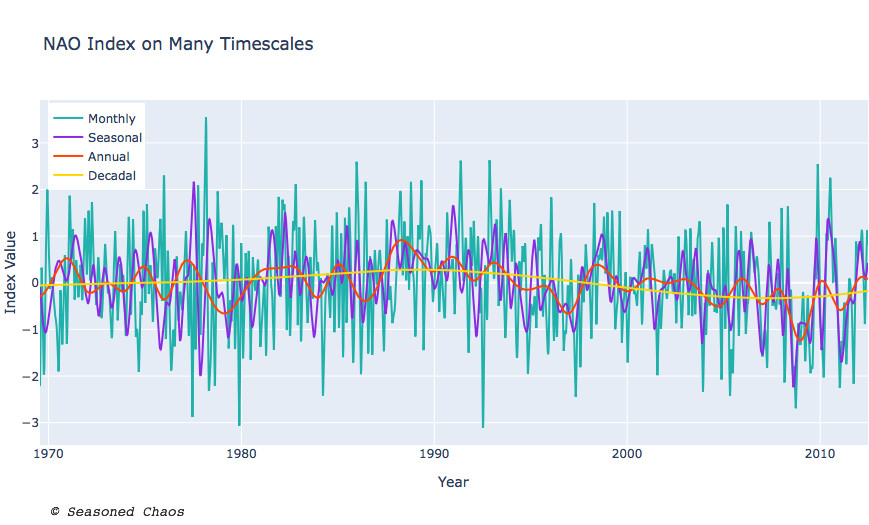
(interactive chart link:) Timeseries of NAO on multiple timescales, such that monthly NAO has larger fluctuations between phases while decadal NAO is a smoother, longer transition between phases. By hovering over the timeseries, you can see that for a particular time, the monthly, seasonal, annual, and decadal NAO have different values and often have different signs (+ or -) too!

But overall, forecasters are not so bad at predicting the NAO phases in the winter, so from a forecasting perspective, it can be good news when the NAO is headlining. :metal:

Written by: Marybeth Arcodia, Kayla Besong, Kurt Hansen, and Kelsey Malloy